3D Cloud Viewer
LIDAR data consists of Point Clouds – these are, usually, many millions of tiny points in 3D space which cam contain colour or reflectivity data. If you zoom out they look like a model of the real world. If you zoom in, you begin to see the individual points – hence the name Point Cloud.
The Cloud Viewer tool allows you to do basic viewing and measuring on the cloud data. When it first opens you should see the entire point cloud coloured to look like terrain. When you open a lidar point cloud, the cloud viewer appears in a new Browser Tab (if it does not, check your pop-up blocker settings).
The main body of the viewer shows the point cloud, and on the right hand side are the viewer tools which help you to move around the point cloud, and take measurements from it.
The resolution of the point cloud is much lower than the equivalent photographs. Here’s an example photo of Cambridge Station:
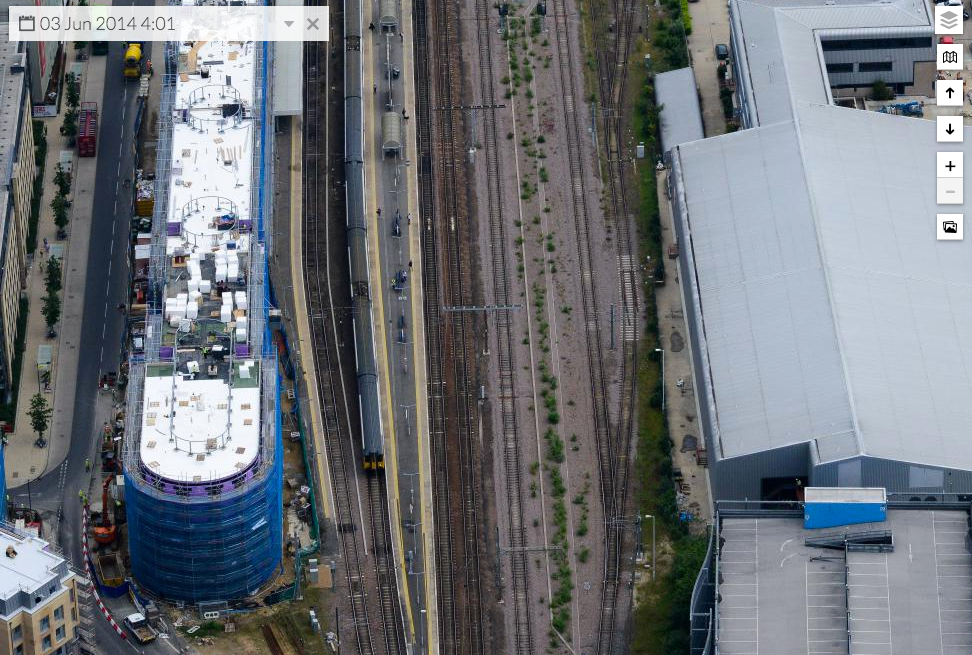
and here is the equivalent view of the point cloud version:
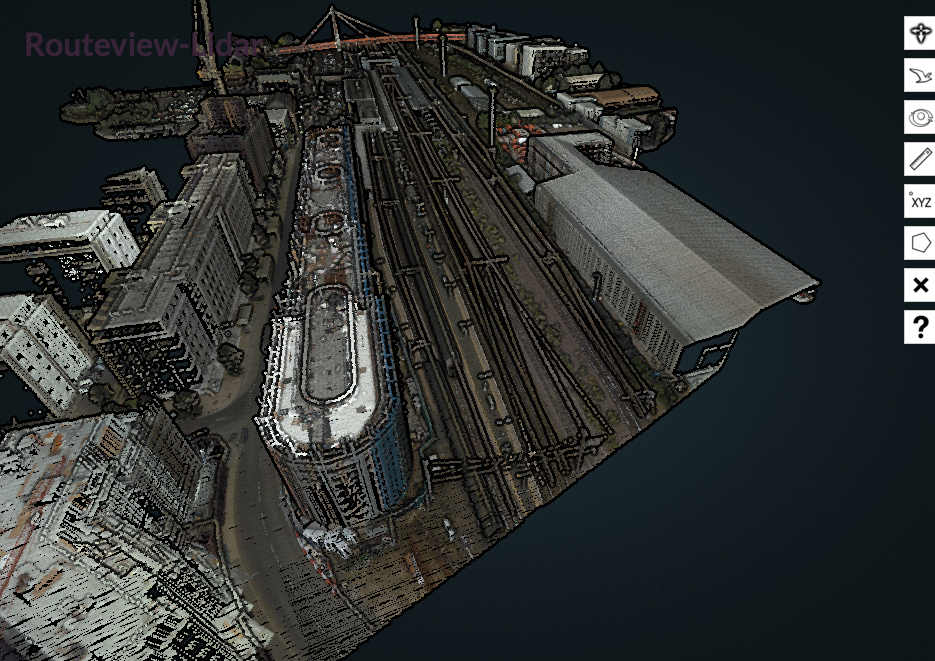
You can see the the quality and resolution of the LIDAR data is much lower than the photo, so you’d want to us the photo for identifying features and detailed visual manipulation. However, the main benefit of the point cloud is the ability to pan and zoom around the image and see things from different angles, and to measure accurately in 3D coordinate space.
Moving Around the Image
To move around the image press the left mouse button and drag the mouse around. If you wish to re-centre the rotation point, press the right mouse button and move the mouse around.
The topmost tools in the toolbar define how the model moves with the mouse:

With the left mouse button pressed, dragging the mouse pans the point cloud around with a static viewpoint and rotation. Use this mode to pan along a section of railway or road once you have positioned the viewpoint.
With the right mouse button pressed, dragging the mouse rotates the model around the point which was under the mouse when the right button was pressed.

With the left mouse button pressed, dragging the mouse will rotate the camera angle. Use this to quickly view the lidar from above.

When moving the viewpoint around the model, it is easy to lose track of direction. Pressing the Top Down View button will rotate the model to match a map – e.g. North is up, looking straight down. This can be useful when using the measuring or drawing tools too.
Measuring on the image

Measures the distance between two or more 3D points on the point cloud.
Select this tool, then click on consecutive points on the point cloud to display the distance between these points. A red dot will appear and follow the cursor until the left mouse button is clicked. To end the measurement process, double click the last point, or right click anywhere on the cloud.
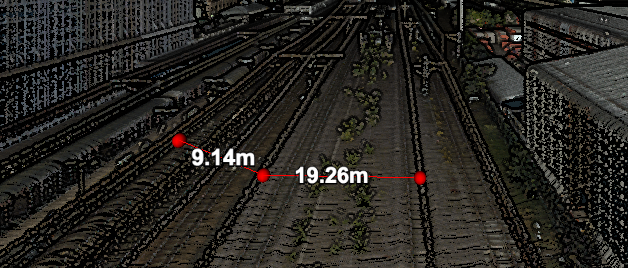
*Note that the measured points remain on the model until you clear them using the Clear Measurements tool. This is a good way to check that you have clicked on the correct 3D point and not somewhere behind it.

Use this tool to measure the area of a closed polygon.
Select the tool and click consecutive points on the model. Double click the last point to end the measurement.
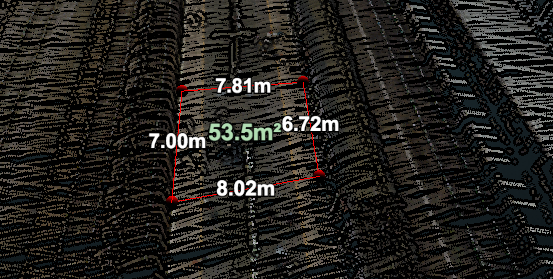
This will give you the length of each side in metres and the total area in square metres.
Use the Clear Measurements tool to remove the lines from the model.

With this tool selected, mouse the mouse over the model and it will display the x, y, and Z coordinates of the point on the ground.
After measuring distances and areas, the measurement lines remain on the model. Click this tool to instantly remove these lines.

Click this icon to enable the Shape Drawing tool – the cursor on the model turns into a blue dot. Click on the model to draw nodes of a polygon based on the point in the point cloud you click on.
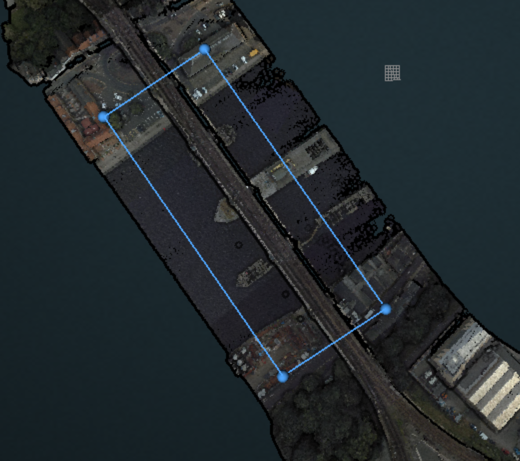
When you want to finish the shape, double click on the model – this will create the last point in the polygon and enable the Save and Clear Shape tools:

Clicking on the Download button will prompt you for a kml file name to save the shape into. Select the output directory and click OK. If you want to cancel the operation and clear the shape, click the Cross Icon to clear the shape.
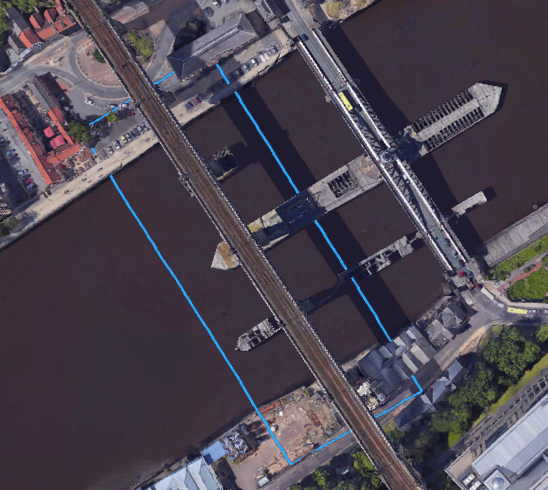
If you open the KML file in, say, Google Earth you will see the same blue polygon:
You can change the display properties of the polygon within Google Earth to produce different views:
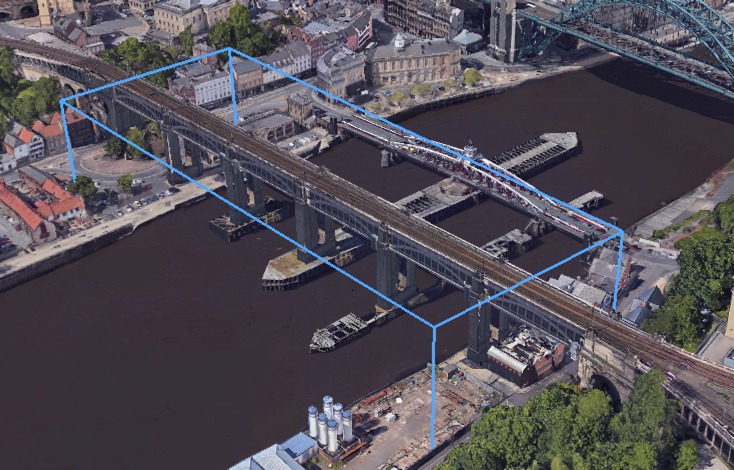
This drawing tool is especially useful for sending outlines to colleagues to highlight certain areas, or to request more detailed LIDAR surveys.

Displays this Help page.